| Support Data | ||||
|---|---|---|---|---|
| View | ||||
 |
map_13963_09sep13.gif | Map showing flight track for this day | ||
| Images and Data | ||||
| View | ||||
 |
imgsum_13963_09sep13_355.gif | Flight summary image showing whole flight for 355 nm | ||
 |
imgsum_13963_09sep13_532.gif | Flight summary image showing whole flight for 532 nm | ||
 |
atb532_13963_09sep13_pbl.gif | Flight summary image for PBL showing whole flight for 532 nm | ||
 |
imgsum_13963_09sep13_1064.gif | Flight summary image showing whole flight for 1064 nm | ||
 |
imgsum_13963_09sep13_depol.gif | Flight summary image showing whole flight for depolarization | ||
 |
imgseg01_13963_09sep13.gif | Start time = 17:00:58 End time = 17:30:58 | ||
 |
imgseg02_13963_09sep13.gif | Start time = 17:30:58 End time = 18:00:58 | ||
 |
imgseg03_13963_09sep13.gif | Start time = 18:00:58 End time = 18:30:58 | ||
 |
imgseg04_13963_09sep13.gif | Start time = 18:30:58 End time = 19:00:58 | ||
 |
imgseg05_13963_09sep13.gif | Start time = 19:00:58 End time = 19:30:58 | ||
 |
imgseg06_13963_09sep13.gif | Start time = 19:30:58 End time = 20:00:58 | ||
 |
imgseg07_13963_09sep13.gif | Start time = 20:00:58 End time = 20:30:58 | ||
 |
imgseg08_13963_09sep13.gif | Start time = 20:30:58 End time = 21:00:58 | ||
 |
imgseg09_13963_09sep13.gif | Start time = 21:00:58 End time = 21:30:58 | ||
 |
imgseg10_13963_09sep13.gif | Start time = 21:30:58 End time = 22:00:58 | ||
 |
imgseg11_13963_09sep13.gif | Start time = 22:00:58 End time = 22:30:58 | ||
 |
imgseg12_13963_09sep13.gif | Start time = 22:30:58 End time = 23:00:58 | ||
 |
imgseg13_13963_09sep13.gif | Start time = 23:00:58 End time = 23:30:58 | ||
 |
imgseg14_13963_09sep13.gif | Start time = 23:30:58 End time = 00:00:58 | ||
 |
imgseg15_13963_09sep13.gif | Start time = 00:00:58 End time = 00:08:53 | ||
 |
layers_13963_09sep13.txt | Layer boundary file showing type and location of all atmospheric layers sensed | ||
|
cipbl_13963_09sep13.txt | Quick optical file showing optical depth and extinction-to-backscatter ratio calculations for a pre-defined cirrus zone and the cloud-cleared Planetary Boundary Layer for 355, 532, and 1064 nm. | ||
|
CIPBL_readme.txt | Text file describing how to interpret and use the quick optical file. | ||
 |
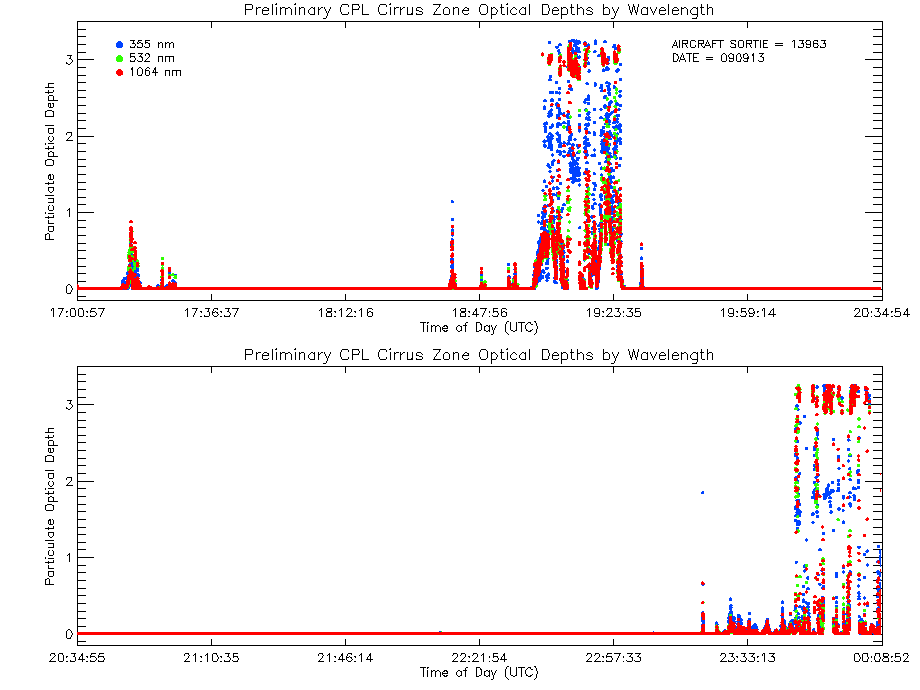
ciod_13963_09sep13_line.gif | Optical Depth Plots (Cirrus), from the Quick Optical File | ||
 |
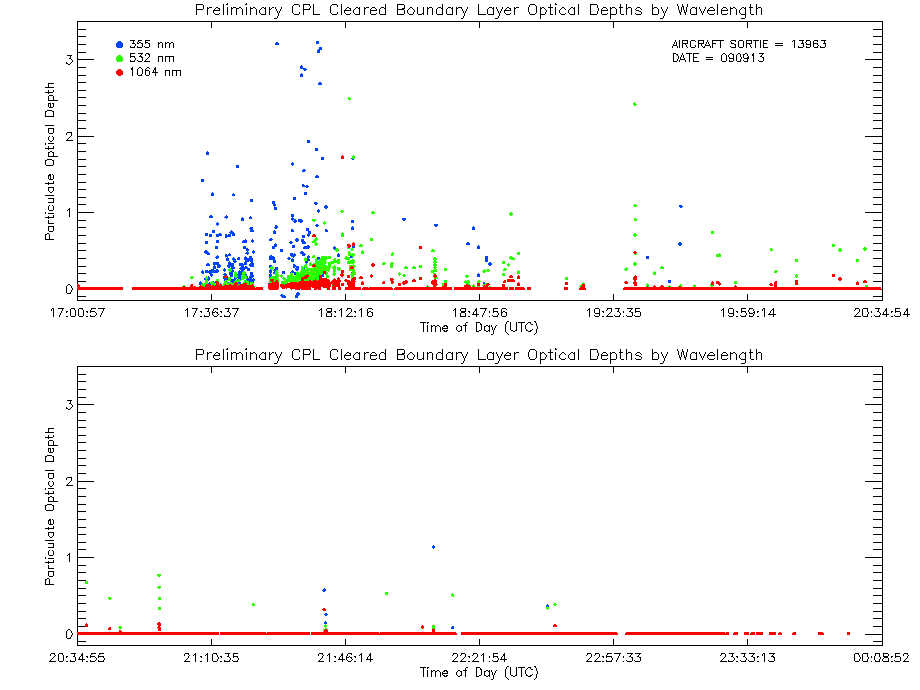
pblod_13963_09sep13b.gif | Optical Depth Plots (PBL), from the Quick Optical File | ||
 |
EXTSEG01_13963_09sep13.gif | Start time = 17:00:58 End time = 17:30:58 | ||
 |
EXTSEG02_13963_09sep13.gif | Start time = 17:30:58 End time = 18:00:58 | ||
 |
EXTSEG03_13963_09sep13.gif | Start time = 18:00:58 End time = 18:30:58 | ||
 |
EXTSEG04_13963_09sep13.gif | Start time = 18:30:58 End time = 19:00:58 | ||
 |
EXTSEG05_13963_09sep13.gif | Start time = 19:00:58 End time = 19:30:58 | ||
 |
EXTSEG06_13963_09sep13.gif | Start time = 19:30:58 End time = 20:00:58 | ||
 |
EXTSEG07_13963_09sep13.gif | Start time = 20:00:58 End time = 20:30:58 | ||
 |
EXTSEG08_13963_09sep13.gif | Start time = 20:30:58 End time = 21:00:58 | ||
 |
EXTSEG09_13963_09sep13.gif | Start time = 21:00:58 End time = 21:30:58 | ||
 |
EXTSEG10_13963_09sep13.gif | Start time = 21:30:58 End time = 22:00:58 | ||
 |
EXTSEG11_13963_09sep13.gif | Start time = 22:00:58 End time = 22:30:58 | ||
 |
EXTSEG12_13963_09sep13.gif | Start time = 22:30:58 End time = 23:00:58 | ||
 |
EXTSEG13_13963_09sep13.gif | Start time = 23:00:58 End time = 23:30:58 | ||
 |
EXTSEG14_13963_09sep13.gif | Start time = 23:30:58 End time = 00:00:58 | ||
 |
EXTSEG15_13963_09sep13.gif | Start time = 00:00:58 End time = 00:08:53 | ||
 |
cod_13963_09sep13.gif | Cloud Optical Depth Plot (three wavelength) | ||
 |
aod_13963_09sep13.gif | Aerosol Optical Depth Plot (three wavelengths) | ||
 |
tod_13963_09sep13.gif | Total Optical Depth Plot (three wavelength) | ||




| Large Binary Output Files | |||
|---|---|---|---|
| NRB_13963_09sep13.xdr | NRB Binary Output containing Lidar profiles after instrument corrections but before calibrated backscatter | ||
| OP_13963_09sep13.xdr | Final Optical Binary Output containing optical properties of every layer sensed, including optical depth, extinction-to-backscatter ratio, and extinction profile for 355, 532, and 1064 nm. | ||
| text | cal_13963_09sep13.final | Request calibration file. This file contains the instrument calibration coefficients used to generate attenuated backscatter data from the NRB binary data. | |
| *Note* Binary output files are large (most files are 500MB). If you want the binary output files above, click on the filename to download. |
|||